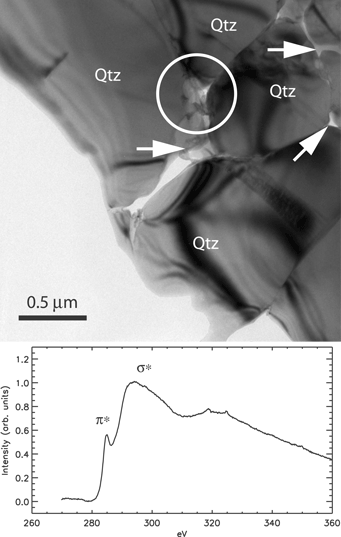
 To give you some idea of what I'm doing, here's a figure I made today for my dissertation (Chapter 3). First I had to match up the EELS data with the correct image, then pick the best image to use (there were three different ones). I saved the data from my big Excel workbook to a single CSV file, which I could read with IDL. I like to plot with IDL because I have more control over plotting. But in IDL the output is a postscript file, so then I open it up in Illustrator. To add the image, I have to extract the JPEG from Digital Micrograph (TEM software) and then import into Illustrator. In Illustrator I can now combine the spectrum with the corresponding image, and add labels, scale bar, arrows, and circle to represent the beam spot, making sure that everything will fit on a printed page. But I'm not done yet. For printing, line drawings don't look good unless they're printed at greater than 600 dpi. However, Microsoft Word only opens postscript files at 72 dpi. So I save the figure as an encapsulated postscript (which allows you to manually set the resolution) and open it up in Photoshop. I ran some tests and 720 dpi work well for me, so I set the resolution to 720 dpi and save the final draft as a grayscale PNG file. A reduced version of the final figure is what you see here. If I know exactly what I want to do, this process takes me about an hour, which may be overkill for one figure, but I end up with a nice journal quality high resolution figure plus an original that I can easily change and alter for the future.
Wednesday, May 10, 2006
To give you some idea of what I'm doing, here's a figure I made today for my dissertation (Chapter 3). First I had to match up the EELS data with the correct image, then pick the best image to use (there were three different ones). I saved the data from my big Excel workbook to a single CSV file, which I could read with IDL. I like to plot with IDL because I have more control over plotting. But in IDL the output is a postscript file, so then I open it up in Illustrator. To add the image, I have to extract the JPEG from Digital Micrograph (TEM software) and then import into Illustrator. In Illustrator I can now combine the spectrum with the corresponding image, and add labels, scale bar, arrows, and circle to represent the beam spot, making sure that everything will fit on a printed page. But I'm not done yet. For printing, line drawings don't look good unless they're printed at greater than 600 dpi. However, Microsoft Word only opens postscript files at 72 dpi. So I save the figure as an encapsulated postscript (which allows you to manually set the resolution) and open it up in Photoshop. I ran some tests and 720 dpi work well for me, so I set the resolution to 720 dpi and save the final draft as a grayscale PNG file. A reduced version of the final figure is what you see here. If I know exactly what I want to do, this process takes me about an hour, which may be overkill for one figure, but I end up with a nice journal quality high resolution figure plus an original that I can easily change and alter for the future.
Subscribe to:
Post Comments (Atom)

1 comment:
Sweet figure, Brad!
Post a Comment