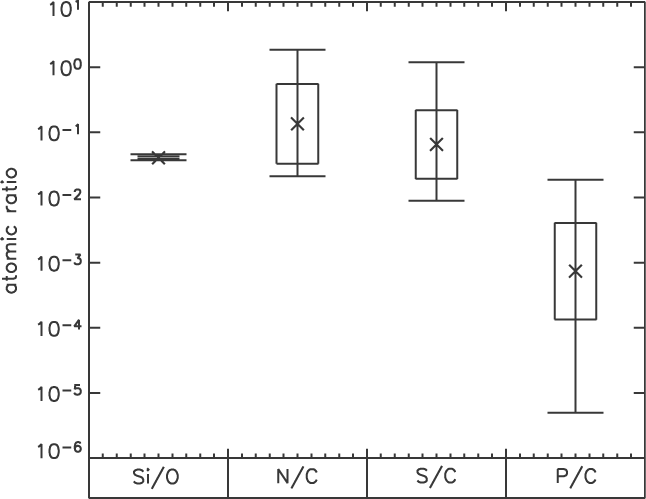
 I wanted to post this figure because it took me a while to figure out how to present the data. It shows the average, standard deviation, and max/min values of four atomic ratios in my sample. IDL is a bit limited for error plots like this, but I managed to figure it out. The vertical sides of the boxes were actually added in Illustrator. As for the data, I had to convert everything to log scale to calculate the means and standard deviations, but I needed to convert back to linear scale to plot the data (even though the final plot is still in log scale). There is a keyword flag for making the box labels at the bottom of the plot, but I had to center the labels in Illustrator. I think the figure really shows the relationship between the ratios like I wanted to show them.
Thursday, September 07, 2006
I wanted to post this figure because it took me a while to figure out how to present the data. It shows the average, standard deviation, and max/min values of four atomic ratios in my sample. IDL is a bit limited for error plots like this, but I managed to figure it out. The vertical sides of the boxes were actually added in Illustrator. As for the data, I had to convert everything to log scale to calculate the means and standard deviations, but I needed to convert back to linear scale to plot the data (even though the final plot is still in log scale). There is a keyword flag for making the box labels at the bottom of the plot, but I had to center the labels in Illustrator. I think the figure really shows the relationship between the ratios like I wanted to show them.
Subscribe to:
Post Comments (Atom)

No comments:
Post a Comment